The following is a summary of a presentation conducted by our team for the American Thoracic Society 2022 International Conference, which took place May 13-18, 2022. For more information, visit https://www.atsjournals.org/doi/abs/10.1164/ajrccm-conference.2022.205.1_MeetingAbstracts.A2380.
Impact of a Real-Time Ventilator Management Dashboard with Alerts: Sustained Hospital-Wide Improvement in Lung Protective Ventilation
P. Tandon1, K. Nguyen2, G. Raut2, S. Ranginwala3, G. Oldenberg3, K. S. Mathews4, P. Timsina2, R. Kohli-Seth5, R. Freeman2, C.A. Powell1, M. Levin6; 1Pulmonary, Critical Care and Sleep Medicine, Icahn School of Medicine at Mount Sinai, New York, NY,United States, 2Institute for Healthcare Delivery Science, Icahn School of Medicine at Mount Sinai, New York, NY, United States,3Respiratory Care Services, Icahn School of Medicine at Mount Sinai, New York, NY, United States, 4Div of Pulm Critical Care &Sleep Medicine, Icahn School of Medicine at Mount Sinai, New York, NY, United States, 5Institute for Critical Care Medicine,Icahn School of Medicine at Mount Sinai, New York, NY, United States, 6Anesthesiology, Perioperative & Pain Medicine, Icahn School of Medicine at Mount Sinai, New York, NY, United States.
Corresponding author’s email: pranai.tandon@mountsinai.org
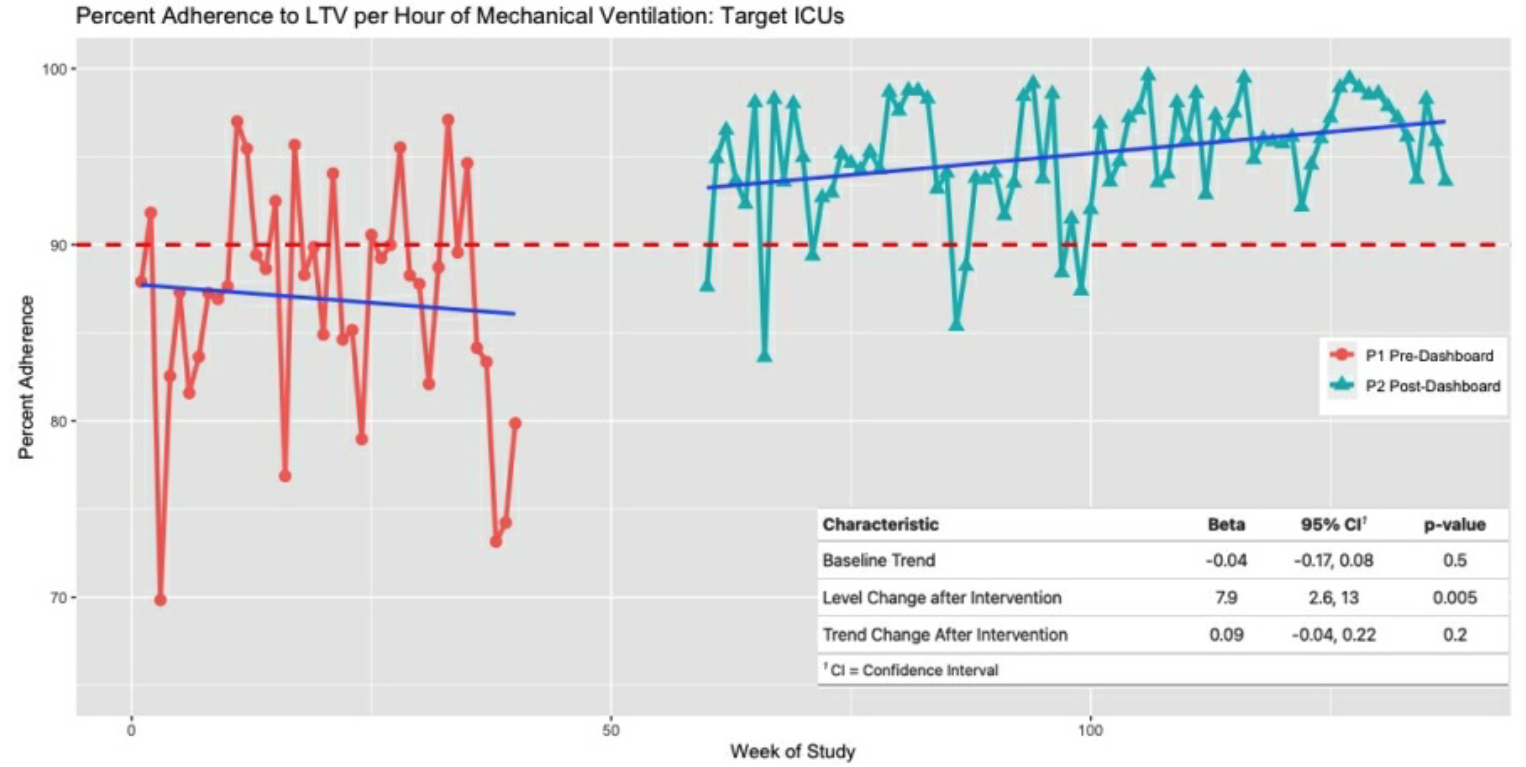
RATIONALE: Exposure to high tidal volumes in patients undergoing invasive Mechanical Ventilation (MV) is associated within creased mortality and worse outcomes even in patients without respiratory failure. Consistent adherence to Lung Protective Ventilation (LPV), here defined as tidal volume ≤8cc/kg Ideal Body Weight (IBW), can be challenging. We developed a real-time ventilator management dashboard that sends twice daily alerts communicating synthesized ventilator information to clinicians,with the goal of improving LPV adherence. METHODS: The Respiratory Insights Dashboard (RID) displays key real-time patient and ventilator data for all patients across 8 ICUs in a large tertiary care academic hospital. Variables include: respiratory support device, IBW, airway pressures, set and measured tidal volumes, and arterial blood gases. Out-of-range values are highlighted in red; summary counts of patients out of adherence to LPV in each ICU are placed above patient-level data. The RID also sends twice daily e-mail alerts to ICU staff identifying patients with out-of-range parameters. The five ICUs (target ICUs) with historically lowest LPV adherence were pre-specified for analysis, including two cardiac/cardiothoracic ICUs, two neuroscience ICUs, and a surgical ICU. The primary outcome was hourly percent adherence to LPV during the Pre-Implementation period (8/1/2019-3/14/2020) and Post-Implementation period (8/1/2020-10/31/2021). The secondary outcome was duration of MV before ventilator settings reached ≤8cc/kg IBW. Interrupted time-series regression was used to evaluate the primary outcome accounting for temporal trends. RESULTS: 1,407 patients received MV in target ICUs in the pre-intervention period, and 3,159 in the post-intervention period. Mean Age (62 vs 61), IBW (63kg vs 63kg), SOFA score (5.4 vs 4.8), Elixhauser score (1.98 vs 1.97), or history of underlying lung disease (17% vs 17%) were not significantly different between periods. Percent adherence to LPV rose from 78% to 87% in target ICUs (p <0.001), with duration of MV before reaching adherence to LPV falling from median 9hr (IQR2,26) to 5hr (IQR 1,15) (p=0.052). Interrupted time-series regression (Figure) showed temporal trends both before and after intervention were not significantly different from zero; however, adherence level change after intervention was 7.9 (p=0.005).CONCLUSION: A real-time ventilator management dashboard significantly improved adherence to LPV hospital-wide; there was also a trend towards more-rapid correction of sub-optimal ventilator settings. Implementation was associated with a jump in LPV adherence that has persisted for 15 months of follow-up, across multi-disciplinary ICUs.