
This paper was published in BMJ Supportive and Palliative Care 2022;12:e424-e431.
Parchure P, Joshi H, Dharmarajan K, et al. Development and validation of a machine learning-based prediction model for near-term in-hospital mortality among patients with COVID-19. BMJ Supportive & Palliative Care 2022;12:e424-e431.
Abstract
Objectives To develop and validate a model for prediction of near-term in-hospital mortality among patients with COVID-19 by application of a machine learning (ML) algorithm on time-series inpatient data from electronic health records.
Methods A cohort comprised of 567 patients with COVID-19 at a large acute care healthcare system between 10 February 2020 and 7 April 2020 observed until either death or discharge. Random forest (RF) model was developed on randomly drawn 70% of the cohort (training set) and its performance was evaluated on the rest of 30% (the test set). The outcome variable was in-hospital mortality within 20–84 hours from the time of prediction. Input features included patients’ vital signs, laboratory data and ECG results.
Results Patients had a median age of 60.2 years (IQR 26.2 years); 54.1% were men. In-hospital mortality rate was 17.0% and overall median time to death was 6.5 days (range 1.3–23.0 days). In the test set, the RF classifier yielded a sensitivity of 87.8% (95% CI: 78.2% to 94.3%), specificity of 60.6% (95% CI: 55.2% to 65.8%), accuracy of 65.5% (95% CI: 60.7% to 70.0%), area under the receiver operating characteristic curve of 85.5% (95% CI: 80.8% to 90.2%) and area under the precision recall curve of 64.4% (95% CI: 53.5% to 75.3%).
Conclusions Our ML-based approach can be used to analyse electronic health record data and reliably predict near-term mortality prediction. Using such a model in hospitals could help improve care, thereby better aligning clinical decisions with prognosis in critically ill patients with COVID-19.
Data availability statement
Data are available upon reasonable request. Raw data were generated at the Mount Sinai Health System. Derived data supporting the findings of this study are available from the corresponding author (MM) on request.
This article is made freely available for personal use in accordance with BMJ’s website terms and conditions for the duration of the covid-19 pandemic or until otherwise determined by BMJ. You may use, download and print the article for any lawful, non-commercial purpose (including text and data mining) provided that all copyright notices and trade marks are retained.
https://bmj.com/coronavirus/usage
http://dx.doi.org/10.1136/bmjspcare-2020-002602
Request Permissions
If you wish to reuse any or all of this article please use the link below which will take you to the Copyright Clearance Center’s Rights Link service. You will be able to get a quick price and instant permission to reuse the content in many different ways.
Introduction
The surge in hospitalisations and intensive care unit (ICU) admissions due to patients with severe COVID-191 has shown the need for effective prognostication, so that clinicians working with limited resources can formulate appropriate goals of care based on patients’ varying risk of deterioration. Timely and targeted delivery of palliative care services is an important component of COVID-19 management. With such data, providers could help manage symptoms of severe infection and foster shared decision making with patients and families well before clinical deterioration and death. However, the appropriate timing of initiation of goals-of-care and/or palliative care consultations is difficult to gauge given the largely unpredictable disease trajectory of COVID-19 and how suddenly patients’ conditions can deteriorate.2 Age and pre-existing high-risk conditions3 can be baseline predictors of mortality. However, a number of patients with COVID-19 without underlying high-risk conditions have needed hospitalisation, required ICU care or died (26%, 23% and 5%, respectively).4 These data indicate that using baseline risk factors to assess mortality risk may have limited clinical utility in the context of COVID-19.
Manual assessments are performed to evaluate patients’ overall clinical condition, assess the need for interventions and identify those at higher risk of poor prognosis. As an aid to the manual assessments, score-based approaches5–7 have been proposed to improve the process of patient prognostication. However, validity of these approaches remains to be established for COVID-19 hospitalisations. Moreover, the repeated elicitation of scores during hospitalisation can be laborious. Supervised machine learning (ML) can provide an opportunity to frequently assess large number of relevant variables, their temporal changes and the known as well as unknown interactions among variables with respect to the prognostic outcome.
We aimed to develop a novel supervised ML-based prediction tool to help clinical teams identify inpatients with COVID-19 at higher risk of near-term in-hospital mortality, and to assist the palliative care clinicians in determining when to hold emotionally charged conversations regarding prognosis and care for these patients. We used inpatient time-series data from the institution’s electronic health record (EHR) system and applied a random forest (RF) approach. Here, we describe the development, validation and interpretation of this model.
Materials and methods
The study was approved by the institutional research board, which waived the need for informed consent.
Data source
We compiled retrospective cohort data from the Mount Sinai Health System COVID-19 registry, which included admission–discharge–transfer events, administrative data, time-series data of clinical assessments, and laboratory and ECG results. Our study complies with the transparent reporting of a multivariable prediction model for individual prognosis or diagnosis (TRIPOD) reporting guideline for development and validation of prediction models.
Study population
The cohort included adults ≥18 years old with a COVID-19 diagnosis who were admitted to the Mount Sinai Hospital between 10 February 2020 and 7 April 2020. We defined a COVID-19 diagnosis based on either of the following criteria: (a) positive detection of SARS-CoV-2 by reverse transcriptase-PCR assay or (b) clinical diagnosis of COVID-19 made by an infectious disease specialist.
Selection of variables
Data compiled for this study included patient demographics (eg, age, sex); relevant hospital administrative variables (eg, admission type, source of admission); data from nursing flowsheets (eg, vital signs, respiratory pattern); relevant laboratory results and ECG-derived variables (eg, P wave axis, PR interval or QRS duration). We sought to train a model with the best discriminatory ability based on all clinically relevant variables. Variables used in this study were identified from previously published COVID-19 and critical care evidence.
Sampling strategy
For observational variables, we used the three most recent recorded assessments from time-series data that were available when each feature vector was created. For each patient, we generated daily feature vectors starting from admission date until the date of discharge or death.
Patterns of missingness and imputation
The missingness (ie, all three observations within a feature vector were missing) of laboratory variables ranged between 53.5% and 89.0%. Missingness is largely an indicator that a particular test was not considered necessary and/or relevant by clinical judgement. For each numerical variable, we used median values of non-missing data across the cohort for imputing missing values. For discrete variables, missing values were retained.
Primary outcome
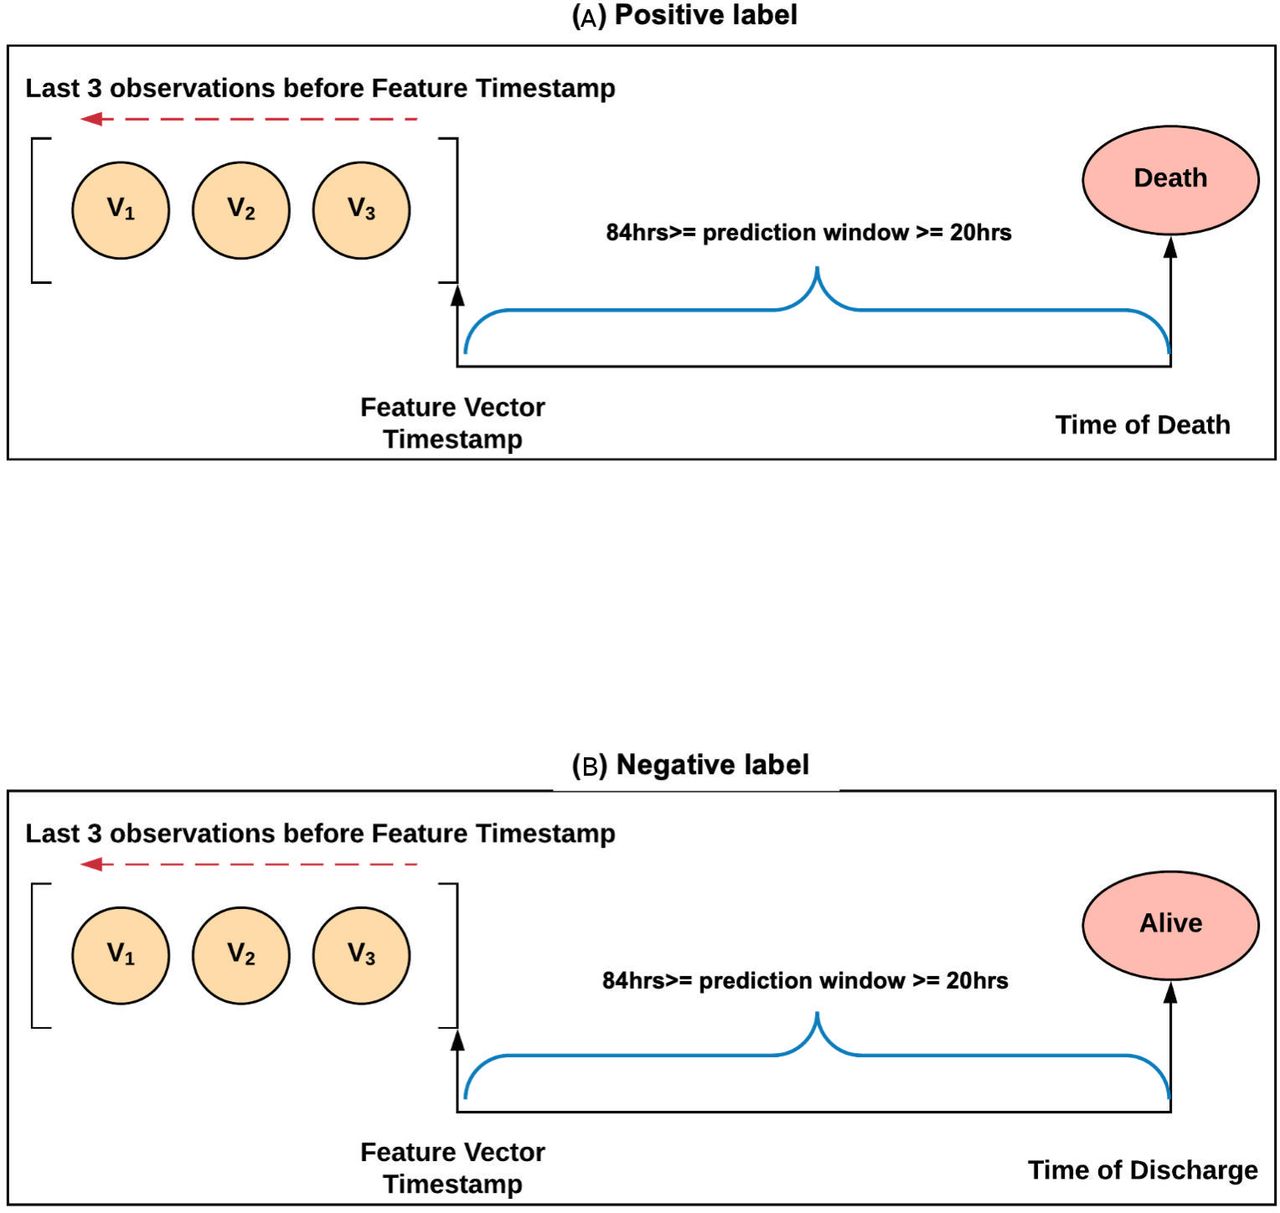
The primary outcome of interest was in-hospital death within 20–84 hours from the time of prediction. This outcome was translated into a label for training the model using discharge disposition and time of feature vector creation. The interval between the time of discharge and the time of generating each feature vector was generated daily for each patient. If the discharge disposition was ‘Expired (ie, dead)’ and the interval was between 20 and 84 hours, we labelled the feature vectors as positive. If the discharge disposition was ‘Not Expired’ and the interval was between 20 and 84 hours, we labelled the feature vectors negative. We excluded the remaining feature vectors from our cohort.
The labelling strategy is illustrated in figure 1.
Figure 1 Feature vector labelling strategy. (A) positive labels; (B) negative labels. V1–V3: values of observations used for creating the feature vector.
Justification of time window of outcomes
For pragmatic reasons, we defined near-term outcomes as those occurring between 20 and 84 hours from the prediction time. Approximately a day (20 hours) would allow time for providers for manual assessment by clinicians, trying interventions to prevent further deterioration and for performing the goals-of-care and/or palliative care consultations to develop an individualised plan of care after their clinical assessment. The 3 days horizon (72 hours) was extended by 12 hours for operational reasons of accommodating a complete day at a hospital until evening.
Model training and development
Cohort data were randomly split into training (~70%) and test (~30%) sets. Because the distribution of positive and negative feature vectors was imbalanced (17.9% vs 82.1%), we performed random under-sampling on the majority class in the training set until both classes became balanced. An RF algorithm was chosen for training the model with 10-fold cross-validation, using the open source Apache Spark project ML library. The resultant fitted model was then applied to the test set.
Importance of variables
Features included in the final RF model were ranked using the Gini importance criteria. In this study, each continuous variable had three features, representing the three most recent observations. We calculated the overall importance of each variable by the aggregated sum of Gini importance values of all its underlying features.
Statistical analysis
A default threshold of 0.5 was used on model-derived class probabilities for assigning positive and negative predictions. Model performance statistics included assessment of sensitivity, specificity, accuracy and positive and negative predictive values. We also plotted receiver operating characteristic (ROC) and the precision recall (PR) curves, area under the ROC curve (AUROC) and area under the PR curve (AUPRC). A 95% CI of all performance statistics was obtained. Performance metrics were computed in the R environment by using custom scripts and the R packages—PRROC (V.1.3.1), pROC (V.1.16.9000) and epiR (V.1.0.4).
Clinical utility, need assessment, temporal validation
We applied our model to 910 individuals hospitalised with COVID-19 diagnosis at our institution during the study period and identified those who died in the hospital. RF model predictions were obtained prospectively for each day a patient stayed in the hospital. Positive predictions with high risk of near-term mortality were identified using a threshold of 0.5. Among hospitalisations that ended in death, we identified a subset of patients whom our model predicted as being at high risk of near-term mortality.
We queried the EHR system for documentation of patients with COVID-19 seen by a palliative care service provider, and then categorised this subset (with patients at high model-predicted mortality risk) into two subgroups: (a) patients who received a goals-of-care and/or palliative care consultations before death, either in the emergency department before admission or during their inpatient stay and (b) patients who did not receive either type of consultation before death. From group (b), we identified a subset who could have benefited from such as consultation, based on review of case notes performed by a clinician. These patients who were predicted by our tool as having high risk of mortality are considered as having an unmet need for goals-of-care and/or palliative care consultation.
Results
The model for this cohort consisted of 1360 feature vectors, representing inpatient data from 567 unique individuals hospitalised at our institution with COVID-19. When split into training and test sets, and after under-sampling of the training set, the two sets had 338 and 414 feature vectors, respectively.
Cohort characteristics
Patient characteristics at baseline are shown in table 1. In both the study cohort and test set, more patients were men and the highest proportion of patients were in the 45–65-year age group. In-hospital mortality rates in the overall cohort and test set were similar, as was the median time to death (6.5 days [range: 1.3- 23.0]). No significant differences were observed between the overall and test sets in distributions of race, ethnicity, relevant comorbidities, smoking habits, patients’ residential origin and proportion of patients who received ICU care.
Table 1
Characteristics of patients admitted in the study cohort and test set
| Overall
(N=567) |
Test set
(N=323) |
|
| Age | ||
| Mean (SD) | 59.4 (17.9) | 59.3 (17.8) |
| Median (min, max) | 60.2 (20.1, 97.3) | 61.1 (21.2, 97.3) |
| Age groups | ||
| 18–45 | 139 (24.5%) | 81 (25.1%) |
| 45–65 | 203 (35.8%) | 115 (35.6%) |
| 65–80 | 151 (26.6%) | 87 (26.9%) |
| >80 | 74 (13.1%) | 40 (12.4%) |
| Gender | ||
| Male | 307 (54.1%) | 175 (54.2%) |
| Female | 258 (45.5%) | 147 (45.5%) |
| Missing | 2 (0.4%) | 1 (0.3%) |
| Length of stay | ||
| 0–3 days | 143 (25.2%) | 54 (16.7%) |
| 3–10 days | 332 (58.6%) | 207 (64.1%) |
| >10 days | 92 (16.2%) | 62 (19.2%) |
| Died during hospitalisation | ||
| Yes | 101 (17.8%) | 56 (17.3%) |
| No | 466 (82.2%) | 267 (82.7%) |
| ICU care received | ||
| Yes | 97 (17.1%) | 55 (17.0%) |
| No | 470 (82.9%) | 268 (83.0%) |
| Geographic origin | ||
| Manhattan | 272 (48.0%) | 150 (46.4%) |
| Queens | 85 (15.0%) | 52 (16.1%) |
| Brooklyn | 89 (15.7%) | 54 (16.7%) |
| Bronx | 59 (10.4%) | 30 (9.3%) |
| Staten Island | 3 (0.5%) | 1 (0.3%) |
| Out of New York City | 46 (8.1%) | 29 (9.0%) |
| Out of New York State | 10 (1.8%) | 6 (1.9%) |
| Missing | 3 (0.5%) | 1 (0.3%) |
| Race and ethnicity | ||
| Non-hispanic black | 115 (20.3%) | 74 (22.9%) |
| Non-hispanic white | 127 (22.4%) | 69 (21.4%) |
| Hispanic black | 18 (3.2%) | 7 (2.2%) |
| Hispanic white | 19 (3.4%) | 11 (3.4%) |
| Asian | 23 (4.1%) | 14 (4.3%) |
| Others | 223 (39.3%) | 128 (39.6%) |
| American Indian | 1 (0.2%) | 0 (0%) |
| Pacific Islander | 1 (0.2%) | 0 (0%) |
| Unspecified | 40 (7.1%) | 20 (6.2%) |
| Smoking history | ||
| Current smoker | 21 (3.7%) | 12 (3.7%) |
| Past smoker | 133 (23.5%) | 76 (23.5%) |
| Never smoked | 315 (55.6%) | 182 (56.3%) |
| Unknown | 96 (16.9%) | 52 (16.1%) |
| Missing | 2 (0.4%) | 1 (0.3%) |
| Hypertension | ||
| Yes | 178 (31.4%) | 103 (31.9%) |
| No | 387 (68.3%) | 219 (67.8%) |
| Missing | 2 (0.4%) | 1 (0.3%) |
| Diabetes | ||
| Yes | 124 (21.9%) | 74 (22.9%) |
| No | 441 (77.8%) | 248 (76.8%) |
| Missing | 2 (0.4%) | 1 (0.3%) |
| COPD | ||
| Yes | 20 (3.5%) | 13 (4.0%) |
| No | 545 (96.1%) | 309 (95.7%) |
| Missing | 2 (0.4%) | 1 (0.3%) |
| Obesity | ||
| Yes | 65 (11.5%) | 37 (11.5%) |
| No | 500 (88.2%) | 285 (88.2%) |
| Missing | 2 (0.4%) | 1 (0.3%) |
| Chronic kidney disease | ||
| Yes | 58 (10.2%) | 32 (9.9%) |
| No | 507 (89.4%) | 290 (89.8%) |
| Missing | 2 (0.4%) | 1 (0.3%) |
Table 1
Characteristics of patients admitted in the study cohort and test set
- COPD, chronic obstructive pulmonary disease; ICU, intensive care unit.
Predictors and their importance
Data included in this study were basic demographic and hospital variables, structured clinical assessments including vital signs,7 complete blood count, serum biochemical tests,8 coagulation profile,9 parameters for respiratory function and other complications,10 markers of inflammation11 12 and electrocardiography parameters.13 Fifty-five variables (comprising 175 features) were included in the final version of trained RF model (online supplemental eTable 1). The model hyperparameters used for training the best cross-validated model are listed in online supplemental eTable 2.
Supplemental material
[bmjspcare-2020-002602supp001.pdf]
Implicit feature selection performed by the RF algorithm reflected by non-zero Gini importance values recognised 49 variables corresponding to 99 features accounted in the final model (online supplemental eFigure 1).
Supplemental material
[bmjspcare-2020-002602supp002.pdf]
Predictive performance of the model
Predictive performance of the model is shown in table 2. ROC and PR curves of the RF classifier model are shown in figure 2.
Figure 2
Receiver operating characteristics and precision recall curves of the RF classifier model in our test set. AUPRC, area under the precision recall curve; AUROC, area under the receiver operating characteristic curve; RF, random forest.
Table 2
Predictive performance of near-term mortality by random forest classifier
| Number of feature vectors | # samples labelled positive for near-term mortality (%) | Sensitivity (%) | Specificity (%) | Accuracy (%) | Positive predictive value (%) | Negative predictive value (%) | Area under ROC (%) | Area under PR (%) | |
| Test set | 414 | 74 (17.9) | 87.8 (78.2–94.3) | 60.6 (55.2–65.8) | 65.5 (60.7–70) | 32.7 (26.2–39.7) | 95.8 (92.2–98.1) | 85.5 (80.8–90.2) | 64.4 (53.5–75.3) |
Table 2
Predictive performance of near-term mortality by random forest classifier
- PR, precision recall; ROC, receiver operating characteristic.
Assessment of use and unmet need of goals-of-care/palliative care consultation
Our model predicted 95.2% of in-hospital deaths; among these, 11.6% of patients did not receive a goals-of-care or palliative care consultation. Among those who did, 65.8% received the consultation during their inpatient stay and 15.1% received it in the emergency department. A clinician’s manual review of case notes determined that 53% of those who did not receive a goals-of-care and/or palliative care consultation were appropriate candidates for it, representing 6.2% of the entire cohort (figure 3).
Figure 3
Assessment of use and potentially unmet need for goals-of-care or palliative care (GOC/PC) consultation among patients with COVID-19 who died in the hospital (6.2% of all deaths in the cohort), shown as red slice in centre.
Discussion
We developed an RF-based model for predicting near-term in-hospital mortality of adult patients with COVID-19 by using time-series inpatient data. The model provided adequate discrimination (AUROC 85.5%) without the need for manual preprocessing of data. In contrast to using static variables, our model translates the variability in patients’ conditions into mortality risk predictions.
Modelling of near-term mortality with dynamic risk quantification should incorporate variables that capture the progression of COVID-19 along the common pathways underlying mortality, such as respiratory or multi-organ failure, septic shock and cardiogenic shock from acute myocardial injury and myocarditis.14 Unlike other studies15–18 of predictive models for mortality among patients with COVID-19, ours is the first model to demonstrate feasibility of using multiple clinical variables as time-series data from the EHR. The narrow prediction time-window captured by this model is a key in scenario of acute illness with high risk of in-hospital mortality, as seen with the COVID-19. Some limitations of other predictive models of ICU and in-hospital mortality7 19–24 include accounting for patient characteristics on admission or access to limited variables from inpatient data. Our model addresses these limitations and accounts for the context of COVID-19 management during the pandemic.
The prediction probability generated by the model can be calibrated according to the expected mortality rate. While uncertainty of prognostication in COVID-19 can be a reason of missing the early opportunities of goals-of-care/palliative care consultations, the near-term estimated risk of mortality can be used to create alternative prognostic risk scenarios in order to build the goals-of-care and palliative care consultations with increased confidence. During the COVID-19 crisis, when critical care team may include re-deployed personnel, not specialised in critical care, the prognostication by ML-based model can assist the clinicians. The goals-of-care consultations are performed by any care team member and aim at ensuring that the care team is aware of patients’ values and preferences and that these preferences can be incorporated into hospital care, given the current clinical condition. It involves discussion of prognosis, goals, and noting any patient concerns25 and shared decision on the use of life-supporting interventions.26 27 The palliative care consults are performed by the palliative care specialists and aim at delivering a comprehensive, interdisciplinary care with a focus on improving the quality of life for patients in imminent or established critical condition. These consultations can include goals-of-care discussions. In addition to helping the patients, it also helps to provide much needed support to patient’s family members.28
The model variables of interest
Apart from conventional static prognostic variables, such as age1 emerging as a top variable of significance, variables reflecting renal function status (eg, blood urea nitrogen and serum creatinine) appeared significant, emphasising the importance of pre-existing chronic kidney disease, abnormal renal function and acute kidney injury in COVID-1929 30 and its association with mortality.29 Among the arterial and venous blood gas analysis variables, the model ranked anion gap and PaCO2 higher than markers of hypoxemia (PaO2 and PvO2), supporting the significance of respiratory acidosis31 and hypercapnia in those who died from COVID-19 despite the improvement in oxygenation.32 33 Key markers of inflammation—C reactive protein and complement C4 together with the markers of coagulability—D-dimer, platelet count and activated partial thromboplastin time being predictive in our model, is consistent with the suggestion of severe COVID-19 being coagulopathy with severe immune-inflammatory state.34 Predictive value of ECG variables, such as the axis of T wave, PR interval, indicates importance of cardiac complications in COVID-19 in relation to patient outcome.35 36 Contradictory to the expectation, the N-terminal pro-B-type natriuretic peptide (NT-proBNP), a predictor of mortality in COVID-19,37 ranked low in our model. Among the haematologic variables, lymphocyte count appeared to be predictive. Lymphocyte count has a significance in COVID-19 prognostication11 and COVID-19-associated sepsis.38
We chose an RF algorithm because of its ability to handle complex multi-modal clinical data and elucidate high-order interactions among input variables without compromising the predictive accuracy.39 As another strength of our model, the data elements used in our model include commonly used variables in the clinical management of COVID-19.
Limitations of the model
A small subset of patients was involved in both training and test sets, introducing the potential for contamination between the two sets. However, in general, the daily feature vectors originating from the time-series data differ, even for the same patient encounter. The model requires validation in external and prospective settings, given the variability in various aspects such as patient demographics, care resources and protocols for disease management. The treatment and intervention variables can have potential implications on the disease trajectory and mortality. However, the current version of the model does not include treatment/intervention variables and therefore, generalisability can be limited given the variability in treatment and intervention guidelines by institutions. The model was trained on COVID-19 hospitalisations regardless of patients’ current level of care; in actual practice, the frequency of obtaining clinical assessments may vary by the level of care. Due to our small sample size, we could not train separate models for each specific level of care or age group. Such customisation, however, could elucidate more predictors of near-term mortality. The estimated unmet need for goals-of-care or palliative care consultations is based on a small cohort. Future work is necessary to evaluate the impact of the model’s implementation on the coverage of palliative care and other aspects of clinical workflow.
Practice implications
A tool that accurately predicts mortality risk and is incorporated in the EHR can complement the manual clinical review and help the care providers in various ways. These include expanding the coverage of appropriately timed goals-of-care or palliative care consultations, and escalation or de-escalation of care for facilitating efficient resource utilisation.
Our tool predicted 95% of all COVID-19 hospitalisations associated with in-hospital deaths in the prospective cohort. We also observed that more than half of hospitalised patients who were clinically eligible for goals-of-care or palliative care consultations did not receive them. Prognostication augmented with our model-derived predictions could potentially address this unmet need. At our institution, palliative care services are embedded within various departments and were often proactively provided to the high-risk patients with COVID-19. The extent of unmet need of these consultations could be considerably greater at centres with reduced availability of palliative care services, further highlighting the importance of ML-based mortality prediction.
Our model’s high negative predictive value (95.8%, 95% CI: 92.2% to 98.1%) in assessing near-term mortality risk could be helpful for guiding providers when hospital or staffing resources are strained. Among other potential implications, our model could facilitate timely escalation of care, which can help to reduce the rate of invasive mechanical ventilation.40 This could be especially important in situations where such resources are limited.
In a fast-paced COVID-19 crisis, increased needs of trained manpower along with the need of critical care resources require careful planning. Acute need of critical care resources can be forecasted by using the near-term prognostication by the model together with patients’ critical care preferences. This can help hospitals plan not only for the imminent surge in demand of care but can also assist in making decisions on new admissions, transfers, logistics and staffing.
Conclusion
The ability of our proposed model to predict the near-term mortality in patients with COVID-19 demonstrates its potential to be adapted according to clinical utilities, including its utility for the palliative care services.
Data availability statement
Data are available upon reasonable request. Raw data were generated at the Mount Sinai Health System. Derived data supporting the findings of this study are available from the corresponding author (MM) on request.
Ethics statements
Patient consent for publication
Not required.
References
- ↵
- Bialek S ,
- Boundy E ,
- Bowen V , et al
- . Severe outcomes among patients with coronavirus disease 2019 (COVID-19) – United States, February 12-March 16, 2020. MMWR Morb Mortal Wkly Rep 2020;69:343–6.doi:10.15585/mmwr.mm6912e2 pmid:http://www.ncbi.nlm.nih.gov/pubmed/32214079 Full Text @ Levy LibraryCrossRefPubMedGoogle Scholar
- ↵
- National Center for Immunization and Respiratory Diseases (NCIRD)
- . Interim clinical guidance for management of patients with confirmed coronavirus disease (COVID-19), 2020. Available: https://www.cdc.gov/coronavirus/2019-ncov/hcp/clinical-guidance-management-patients.html [Accessed 8 Apr 2020].Google Scholar
- ↵
- Chow N ,
- Fleming-Dutra K ,
- Gierke R , et al
- . Preliminary estimates of the prevalence of selected underlying health conditions among patients with coronavirus disease 2019 – United States, February 12-March 28, 2020. MMWR Morb Mortal Wkly Rep 2020;69:382–6.doi:10.15585/mmwr.mm6913e2 pmid:http://www.ncbi.nlm.nih.gov/pubmed/32240123 Full Text @ Levy LibraryCrossRefPubMedGoogle Scholar
- ↵
- Gold JAW ,
- Wong KK ,
- Szablewski CM , et al
- . Characteristics and clinical outcomes of adult patients hospitalized with COVID-19 — Georgia, March 2020. Morb Mortal Wkly Rpt 2020.Google Scholar
- ↵
- Le Gall JR ,
- Lemeshow S ,
- Saulnier F
- . A new simplified acute physiology score (saps II) based on a European/North American multicenter study. JAMA 1993;270:2957.doi:10.1001/jama.1993.03510240069035 pmid:http://www.ncbi.nlm.nih.gov/pubmed/8254858 Full Text @ Levy LibraryCrossRefPubMedWeb of ScienceGoogle Scholar
- ↵
- Vincent JL ,
- de Mendonça A ,
- Cantraine F , et al
- . Use of the SOFA score to assess the incidence of organ dysfunction/failure in intensive care units: results of a multicenter, prospective study. Working group on “sepsis-related problems” of the European Society of Intensive Care Medicine. Crit Care Med 1998;26:1793–800.doi:10.1097/00003246-199811000-00016 pmid:http://www.ncbi.nlm.nih.gov/pubmed/9824069 Full Text @ Levy LibraryCrossRefPubMedWeb of ScienceGoogle Scholar
- ↵
- Fika S ,
- Nanas S ,
- Baltopoulos G , et al
- . A novel mortality prediction model for the current population in an adult intensive care unit. Heart Lung 2018;47:10–15.doi:10.1016/j.hrtlng.2017.10.009 pmid:http://www.ncbi.nlm.nih.gov/pubmed/29217106 Full Text @ Levy LibraryPubMedGoogle Scholar
- ↵
- Nicastri E ,
- Petrosillo N ,
- Ascoli Bartoli T , et al
- . National Institute for the Infectious Diseases “L. Spallanzani”, IRCCS. Recommendations for COVID-19 clinical management. Infect Dis Rep 2020;12:8543.doi:10.4081/idr.2020.8543 pmid:http://www.ncbi.nlm.nih.gov/pubmed/32218915 Full Text @ Levy LibraryCrossRefPubMedGoogle Scholar
- ↵
- Zhou F ,
- Yu T ,
- Du R , et al
- . Clinical course and risk factors for mortality of adult inpatients with COVID-19 in Wuhan, China: a retrospective cohort study. Lancet 2020;395:1054–62.doi:10.1016/S0140-6736(20)30566-3 pmid:http://www.ncbi.nlm.nih.gov/pubmed/32171076 Full Text @ Levy LibraryCrossRefPubMedGoogle Scholar
- ↵
- Tang N ,
- Li D ,
- Wang X , et al
- . Abnormal coagulation parameters are associated with poor prognosis in patients with novel coronavirus pneumonia. J Thromb Haemost 2020;18:844–7.doi:10.1111/jth.14768 pmid:http://www.ncbi.nlm.nih.gov/pubmed/32073213 Full Text @ Levy LibraryCrossRefPubMedGoogle Scholar
- ↵
- Cascella M ,
- Rajnik M ,
- Cuomo A , et al
- . Features, evaluation and treatment coronavirus (COVID-19), 2020. Available: https://www.ncbi.nlm.nih.gov/books/NBK554776/ Google Scholar
- ↵
- Henry BM ,
- de Oliveira MHS ,
- Benoit S , et al
- . Hematologic, biochemical and immune biomarker abnormalities associated with severe illness and mortality in coronavirus disease 2019 (COVID-19): a meta-analysis. Clin Chem Lab Med 2020;58:1021–8.doi:10.1515/cclm-2020-0369 pmid:http://www.ncbi.nlm.nih.gov/pubmed/32286245 Full Text @ Levy LibraryCrossRefPubMedGoogle Scholar
- ↵
- Magro C ,
- Mulvey JJ ,
- Berlin D , et al
- . Complement associated microvascular injury and thrombosis in the pathogenesis of severe COVID-19 infection: a report of five cases. Transl Res 2020;220:1–13.doi:10.1016/j.trsl.2020.04.007 pmid:http://www.ncbi.nlm.nih.gov/pubmed/32299776 Full Text @ Levy LibraryCrossRefPubMedGoogle Scholar
- ↵
- Vincent J-L ,
- Taccone FS
- . Understanding pathways to death in patients with COVID-19. Lancet Respir Med 2020;8:430–2.doi:10.1016/S2213-2600(20)30165-X pmid:http://www.ncbi.nlm.nih.gov/pubmed/32272081 Full Text @ Levy LibraryPubMedGoogle Scholar
- ↵
- Bai X ,
- Fang C ,
- Zhou Y , et al
- . Predicting COVID-19 malignant progression with AI techniques. SSRN J 2020.doi:10.2139/ssrn.3557984 Google Scholar
- ↵
- Xie J ,
- Hungerford D ,
- Chen H , et al
- . Development and external validation of a prognostic multivariable model on admission for hospitalized patients with COVID-19. SSRN J 2020.doi:10.2139/ssrn.3562456 Google Scholar
- ↵
- Yan L ,
- Zhang H-T ,
- Goncalves J , et al
- . A machine learning-based model for survival prediction in patients with severe COVID-19 infection. medRxiv 2020.Google Scholar
- ↵
- Lu J ,
- Hu S ,
- Fan R , et al
- . Acp risk grade: a simple mortality index for patients with confirmed or suspected severe acute respiratory syndrome coronavirus 2 disease (COVID-19) during the early stage of outbreak in Wuhan, China. SSRN Electron J 2020.doi:10.2139/ssrn.3543603 Google Scholar
- ↵
- Schwartz N ,
- Sakhnini A ,
- Bisharat N
- . Predictive modeling of inpatient mortality in departments of internal medicine. Intern Emerg Med 2018;13:205–11.doi:10.1007/s11739-017-1784-8 pmid:http://www.ncbi.nlm.nih.gov/pubmed/29290047 Full Text @ Levy LibraryPubMedGoogle Scholar
- ↵
- Lemeshow S ,
- Klar J ,
- Teres D , et al
- . Mortality probability models for patients in the intensive care unit for 48 or 72 hours: a prospective, multicenter study. Crit Care Med 1994;22:1351–8.doi:10.1097/00003246-199409000-00003 pmid:http://www.ncbi.nlm.nih.gov/pubmed/8062556 Full Text @ Levy LibraryCrossRefPubMedWeb of ScienceGoogle Scholar
- ↵
- Dólera-Moreno C ,
- Palazón-Bru A ,
- Colomina-Climent F , et al
- . Construction and internal validation of a new mortality risk score for patients admitted to the intensive care unit. Int J Clin Pract 2016;70:916–22.doi:10.1111/ijcp.12851 pmid:http://www.ncbi.nlm.nih.gov/pubmed/27484461 Full Text @ Levy LibraryCrossRefPubMedGoogle Scholar
- ↵
- Paul E ,
- Bailey M ,
- Pilcher D
- . Risk prediction of hospital mortality for adult patients admitted to Australian and New Zealand intensive care units: development and validation of the Australian and New Zealand risk of death model. J Crit Care 2013;28:935–41.doi:10.1016/j.jcrc.2013.07.058 pmid:http://www.ncbi.nlm.nih.gov/pubmed/24074958 Full Text @ Levy LibraryPubMedGoogle Scholar
- ↵
- Kao R ,
- Priestap F ,
- Donner A
- . To develop a regional ICU mortality prediction model during the first 24 h of ICU admission utilizing MODS and NEMS with six other independent variables from the Critical Care Information System (CCIS) Ontario, Canada. J Intensive Care 2016;4:16.doi:10.1186/s40560-016-0143-6 pmid:http://www.ncbi.nlm.nih.gov/pubmed/26933498 Full Text @ Levy LibraryPubMedGoogle Scholar
- ↵
- Huang YC ,
- Chang KY ,
- Lin SP , et al
- . Development of a daily mortality probability prediction model from intensive care unit patients using a discrete-time event history analysis. Comput Methods Programs Biomed 2013;111:280–9.doi:10.1016/j.cmpb.2013.03.018 pmid:http://www.ncbi.nlm.nih.gov/pubmed/23684900 Full Text @ Levy LibraryPubMedGoogle Scholar
- ↵
- Anderson W ,
- Berlinger N ,
- Ragland J , et al
- . Improving communication about serious illness-implementation guide, 2017. Available: https://www.hospitalmedicine.org/globalassets/clinical-topics/clinical-pdf/ctr-17-0031-serious-illness-toolkit-m1.pdf [Accessed 6 Aug 2020].Google Scholar
- ↵
- National Hospice and Palliative Care Organization
- . Coronavirus disease 2019 (COVID-19) shared decision-making tool, 2020. Available: https://www.nhpco.org/wp-content/uploads/COVID-19-Shared-Decision-Making-Tool.pdf [Accessed 13 May 2020].Google Scholar
- ↵
- Respecting Choices
- . Proactive care planning for COVID-19, 2020. Available: https://respectingchoices.org/wp-content/uploads/2020/04/Proactive_Care_Planning_Conversation_COVID-19_4-13-2020.pdf [Accessed 13 May 2020].Google Scholar
- ↵
- Billings JA
- . What is palliative care? J Palliat Med 1998;1:73–81.doi:10.1089/jpm.1998.1.73 pmid:http://www.ncbi.nlm.nih.gov/pubmed/15859874 Full Text @ Levy LibraryCrossRefPubMedGoogle Scholar
- ↵
- Cheng Y ,
- Luo R ,
- Wang K , et al
- . Kidney disease is associated with in-hospital death of patients with COVID-19. Kidney Int 2020;97:829–38.doi:10.1016/j.kint.2020.03.005 pmid:http://www.ncbi.nlm.nih.gov/pubmed/32247631 Full Text @ Levy LibraryCrossRefPubMedGoogle Scholar
- ↵
- Beier K ,
- Eppanapally S ,
- Bazick HS , et al
- . Elevation of blood urea nitrogen is predictive of long-term mortality in critically ill patients independent of “normal” creatinine. Crit Care Med 2011;39:305–13.doi:10.1097/CCM.0b013e3181ffe22a pmid:http://www.ncbi.nlm.nih.gov/pubmed/21099426 Full Text @ Levy LibraryCrossRefPubMedWeb of ScienceGoogle Scholar
- ↵
- Berend K ,
- Engels R
- . Analysis of acid-base disorders in patients with chronic respiratory failure. Respir Care 2011;56:367–8.doi:10.4187/respcare.01218 pmid:http://www.ncbi.nlm.nih.gov/pubmed/21396336 Full Text @ Levy LibraryFREE Full TextGoogle Scholar
- ↵
- Mauri T ,
- Spinelli E ,
- Scotti E , et al
- . Potential for lung recruitment and ventilation-perfusion mismatch in patients with the acute respiratory distress syndrome from coronavirus disease 2019. Crit Care Med 2020;48:1129–34.doi:10.1097/CCM.0000000000004386 pmid:http://www.ncbi.nlm.nih.gov/pubmed/32697482 Full Text @ Levy LibraryPubMedGoogle Scholar
- ↵
- Gattinoni L ,
- Caironi P ,
- Cressoni M , et al
- . Lung recruitment in patients with the acute respiratory distress syndrome. N Engl J Med 2006;354:1775–86.doi:10.1056/NEJMoa052052 pmid:http://www.ncbi.nlm.nih.gov/pubmed/16641394 Full Text @ Levy LibraryCrossRefPubMedWeb of ScienceGoogle Scholar
- ↵
- Java A ,
- Apicelli AJ ,
- Liszewski MK , et al
- . The complement system in COVID-19: friend and foe? JCI Insight 2020;5. doi:doi:10.1172/jci.insight.140711. [Epub ahead of print: 06 Aug 2020].pmid:http://www.ncbi.nlm.nih.gov/pubmed/32554923 Google Scholar
- ↵
- Inciardi RM ,
- Lupi L ,
- Zaccone G , et al
- . Cardiac involvement in a patient with coronavirus disease 2019 (COVID-19). JAMA Cardiol 2020;5:819.doi:10.1001/jamacardio.2020.1096 Full Text @ Levy LibraryGoogle Scholar
- ↵
- Bonow RO ,
- Fonarow GC ,
- O’Gara PT ,
- O’Gara PT , et al
- . Association of coronavirus disease 2019 (COVID-19) with myocardial injury and mortality. JAMA Cardiol 2020;5:751.doi:10.1001/jamacardio.2020.1105 pmid:http://www.ncbi.nlm.nih.gov/pubmed/32219362 Full Text @ Levy LibraryPubMedGoogle Scholar
- ↵
- Gao L ,
- Jiang D ,
- Wen X-S , et al
- . Prognostic value of NT-proBNP in patients with severe COVID-19. Respir Res 2020;21:83.doi:10.1186/s12931-020-01352-w pmid:http://www.ncbi.nlm.nih.gov/pubmed/32293449 Full Text @ Levy LibraryCrossRefPubMedGoogle Scholar
- ↵
- Aird WC
- . The hematologic system as a marker of organ dysfunction in sepsis. Mayo Clin Proc 2003;78:869–81.doi:10.4065/78.7.869 pmid:http://www.ncbi.nlm.nih.gov/pubmed/12839083 Full Text @ Levy LibraryCrossRefPubMedWeb of ScienceGoogle Scholar
- ↵
- Basu S ,
- Kumbier K ,
- Brown JB , et al
- . Iterative random forests to discover predictive and stable high-order interactions. Proc Natl Acad Sci U S A 2018;115:1943–8.doi:10.1073/pnas.1711236115 pmid:http://www.ncbi.nlm.nih.gov/pubmed/29351989 Full Text @ Levy LibraryAbstract/FREE Full TextGoogle Scholar
- ↵
- Sun Q ,
- Qiu H ,
- Huang M , et al
- . Lower mortality of COVID-19 by early recognition and intervention: experience from Jiangsu Province. Ann Intensive Care 2020;10:33.doi:10.1186/s13613-020-00650-2 pmid:http://www.ncbi.nlm.nih.gov/pubmed/32189136 Full Text @ Levy LibraryCrossRefPubMedGoogle Scholar
Footnotes
- Twitter @RFreeman_RN
- PT and AK contributed equally.
- Contributors AK and PT conceived the study and supervision. PP and PT contributed to data curation. PP, PT, AK and HJ contributed to formal analysis. HJ and KD contributed to formal validation of data and results. HJ and MM contributed to drafting of the original manuscript. All authors contributed to critical revision of the manuscript for important intellectual content.
- Funding This study was funded by National Institute of Aging (P30AG028741), Division of Cancer Prevention, National Cancer Institute (P30CA196521).
- Competing interests None declared.
- Provenance and peer review Not commissioned; externally peer reviewed.
- Supplemental material This content has been supplied by the author(s). It has not been vetted by BMJ Publishing Group Limited (BMJ) and may not have been peer-reviewed. Any opinions or recommendations discussed are solely those of the author(s) and are not endorsed by BMJ. BMJ disclaims all liability and responsibility arising from any reliance placed on the content. Where the content includes any translated material, BMJ does not warrant the accuracy and reliability of the translations (including but not limited to local regulations, clinical guidelines, terminology, drug names and drug dosages), and is not responsible for any error and/or omissions arising from translation and adaptation or otherwise.